The price of crude oil has rebounded about 90% from the February 11th low of $26.05 per barrel, or the "Janet Yellen low", when Federal Reserve Chair Janet Yellen told the U.S. Congress on the second day of her two-day semiannual monetary policy report that overseas weakness and market distress could threaten the Fed's plans to raise the rate gradually this year, but didn't explicitly mention any delays to interest rate hikes.
The recent rally in WTI crude price, to the upper trading range of $50 per barrel, was fueled by headline news of militant attacks on oil infrastructure in Nigeria, which knocked out close to 40% of the country's oil output. Adding to the price premium were Libya's oil export troubles, as a fight over petroleum revenue between factions escalated, and the uncontrolled wildfire in Canada's province of Alberta that shut down one major oil sands mining operation and forced another to curtail production. Canada's total oil sands production is nearly 2 million barrels per day, or bpd, much of which is exported to the U.S.
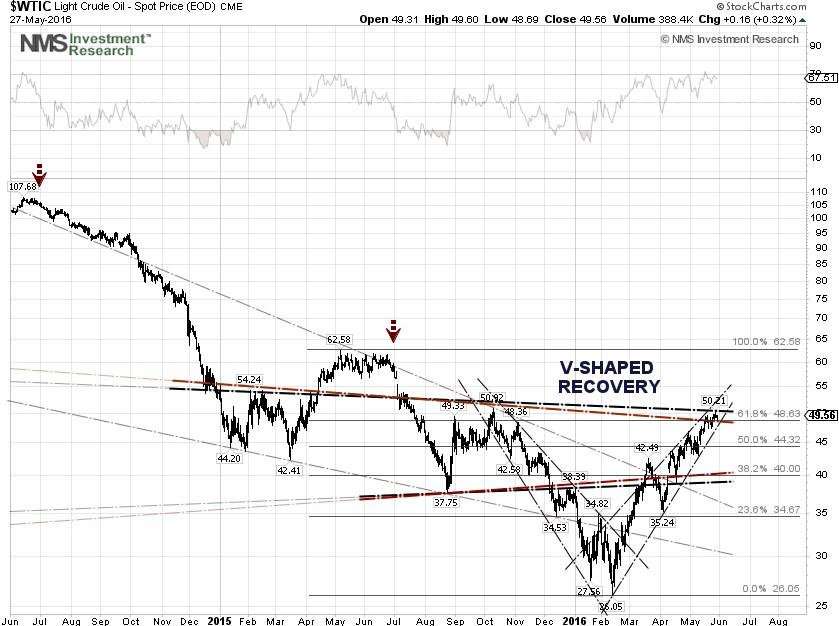
Crude oil prices have made a V-shaped rebound and may be due for a technical correction, as the Organization of the Petroleum Exporting Countries, or OPEC, meeting and Fed rate hikes loom. The timing of the correction is difficult to predict, but in the past two years, the price of crude has seen a decline around the Independence Day holiday in the U.S, the Fourth of July.
Based upon the Short-Term Energy Outlook, or STEO, report, released by the U.S. Energy Information Administration, or EIA, in early May, the WTI crude price could be trading between $40 and $50 per barrel, or the 38.2% and 61.8% Fibonacci retracement levels, until global supply and demand rebalance in the third-quarter 2017. The EIA forecasted in the STEO report that the average WTI crude price will be $40.32 per barrel in 2016 and $50.65 per barrel in 2017, while the average Brent crude price would be $40.52 per barrel in 2016 and $50.65 per barrel in 2017.
A correction in crude prices will hit the Forex market, as many currencies are highly correlated to crude oil. According to Christian Lawrence, senior market strategist at Australia's Rabobank,
Countries heavily reliant on oil production for exports and revenues are of course more sensitive to shifts in oil prices, but so too are those who are heavy importers of oil with their currencies showing a clear inverse relationship.
Divergence Continues to Widen Between Crude Oil Prices and Economic Indicators
The demand for crude oil in the U.S. will remain virtually flat until 2017, due to the weak economy or other reasons. According to the EIA, the supply of crude oil in the U.S. will continue to decline until 2017, while demand could pick up a mere 0.72% in 2016, to 19.54 million bpd compared to an average of 19.4 million bpd in 2015. The EIA forecasts a 0.61% rise in crude demand in 2017, to 19.66 million bpd. Gasoline consumption is forecasted to increase 1.7% in 2016, despite low retail prices and strong job growth, and remains flat in 2017.
There are warning signs that the U.S. economy may not be as strong as Federal Reserve officials have painted it to be, as job growth is decelerating while the core inflation rate is trending downward. According to the Department of Labor, U.S. nonfarm payrolls has declined steadily from 295,000 jobs added in October 2015 to 160,000 added in April 2016, while hourly wages inched up a mere 1.18% from $21.21 per hour to $21.46 per hour during the same period, due in part to a rise in minimum wages in some states and cities.
Core personal consumption expenditures, or PCE, excluding food and energy, climbed from 109.86 in October 2015 to 110.655 in March 2016, a small increase of 0.72%. In fact, the core PCE price index for March came in at 1.56% on a year-on-year basis, down from the previous month's upwardly revised 1.72%. Core PCE has been in the 1.5% range since early 2013, well below the Fed's 2.0% target.
Layoffs are mounting but have not made headline news during this election year, as companies are under margin pressure due to slower demand. According to global outplacement consultant Challenger, Gray & Christmas, Inc., the pace of downsizing increased in April, as U.S.-based employers announced workforce reductions totaling 65,141 during the month, with planned job cuts through the first four months of 2016 being the highest January-April total since 2009.
The yield spread between the 10-year and 2-year U.S. Treasury Notes, one of the economic indicators, closed at 0.93 percentage points on May 23, a level not seen since late 2007, just as St. Louis Federal Reserve President James Bullard, a voting member of the FOMC, said in Beijing that a relatively tight labor market in the U.S. may put upward pressure on inflation, raising the case for higher interest rates.
Narrowing spreads may indicate worsening economic conditions in the future, resulting in a flattening yield curve. A very low or negative spread could signal an upcoming recession. Since 1960, each time that the yield spread went negative, a recession followed approximately 12-months later.
From a historical perspective of the Fed leading up to the last U.S. recession, from December 2007 through March 2009, the Fed began hiking the short-term rate from 1.0% to 1.25% in June 2004 as the yield spread between the 10-year and 2-year U.S. Treasury Notes stood at 1.9 percentage points. By the time the Fed raised the key rate by a quarter-percentage point to 5.25% for the last time in June 2006, the yield spread was already in negative territory.
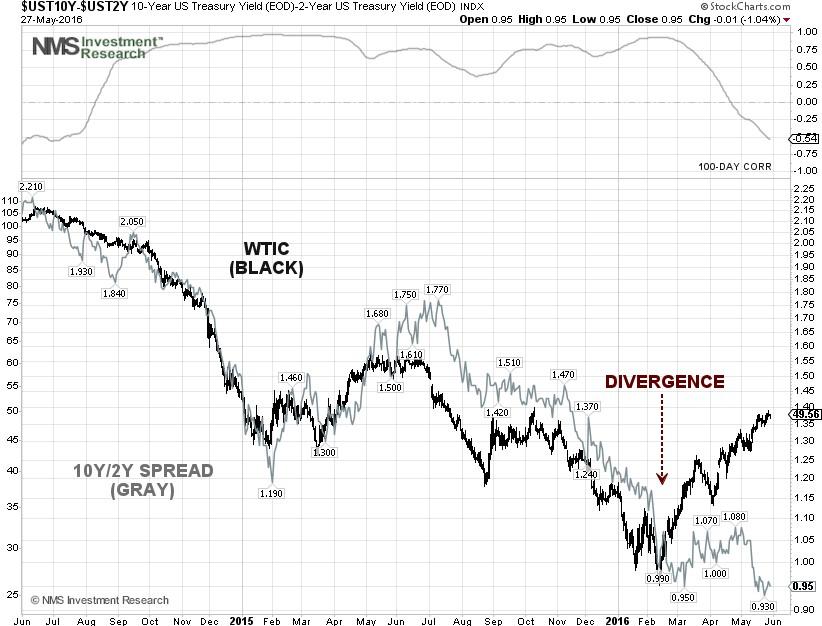
The yield spread between the 10-year and 2-year U.S. Treasury Notes now shows a negative correlation (-0.54) with WTI crude over a 100-day period, as the crude price continues to rise while the yield spread narrows. Thus, crude prices at this level might not be sustainable if future economic conditions worsen.
Many economists may not be aware that the S&P 500 Utilities sector is now trading near its all-time high, as money has rotated into safe-havens. The last time Utilities outperformed the broader market, the U.S. economy entered into a recession 12 months later.
AUD/USD is Already Heading South - CAD/USD May Soon Follow
The AUD/USD exchange rate continued to tumble after the Reserve Bank of Australia, or RBA, minutes from the May 3rd meeting revealed that members discussed the merits of leaving interest rates on hold but decided on balance that a 25 basis point cut to 1.75% would help return inflation to its target over time.
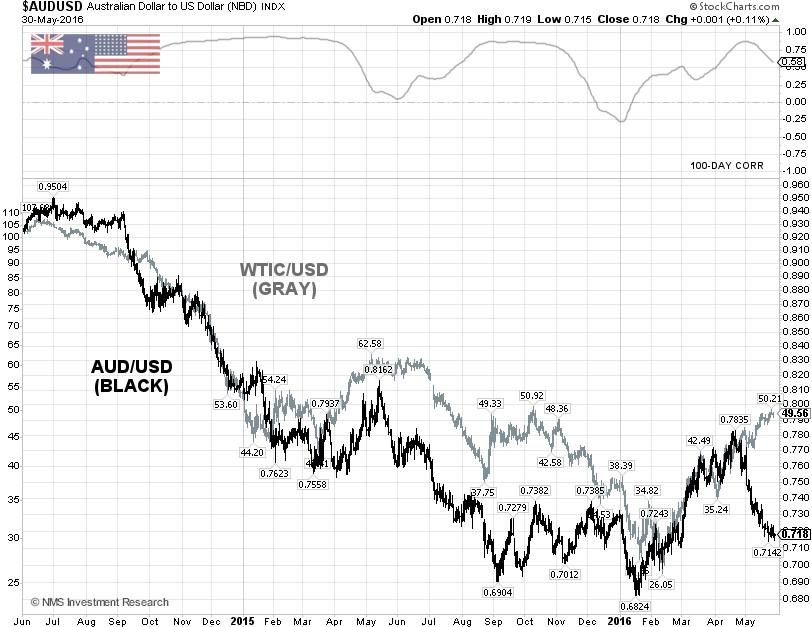
In a recent bearish note, James McIntyre, the head of economic research at Sydney-based investment banking Macquarie Group, said that the RBA will be forced to cut the interest rate to 1% or lower, as a weaker currency or fiscal policy boost are the two available options to lift demand. The AUD/USD pair could be trending lower to the 0.69 and 0.70 support levels, if crude prices start falling. The currency pair still shows a positive correlation (+0.58) with WTI crude over a 100-day period, but the correlation is deteriorating.
The CAD/USD exchange rate, which bottomed in January at 0.6808, rebounded along with crude prices until early May, when Atlanta Fed President Dennis Lockhart and his San Francisco Fed colleague John Williams talked up rate hikes and thereby propped up the U.S. dollar, referred to as a "Fed Dollar Put". Since then, the currency pair has pulled back to the 0.76 support level.

Canada's first-quarter 2016 Gross Domestic Product, or GDP, report, due on May 31, is expected to show an annual growth rate of 2.9%, following the 0.8% expansion during the last three-months of 2015. Nonetheless, the Bank of Canada decided on Wednesday to hold its benchmark interest rate steady at 0.5%, as the Alberta and Saskatchewan wildfires will put second-quarter 2016 GDP into negative territory, said the central bank.
The weak Canadian economic outlook, looming Fed rate hikes and a crude oil price correction could send the currency pair to the 0.73 and 0.74 support levels. The CAD/USD exchange rate still shows a strong positive correlation (+0.86) with WTI crude over a 100-day period, despite that a bearish head and shoulders chart pattern is now emerging.
EUR/USD and GBP/USD Remain Wild Cards
The euro has been weakening against the U.S. dollar, as the Markit preliminary PMI for May indicated continuing expansion in the eurozone economy, but slower than expectations. Retail sales fell sharply in March after rising modestly for the fourth straight month in February, according to the European Union's statistics agency. All eyes will be on the monetary policy meeting of the Governing Council of the European Central Bank, or ECB, in Vienna on June 2. The EUR/USD is trading near 1.121, or the 61.8% Fibonacci retracement level, and could bounce to the upside if the ECB maintains its monetary policy and the U.S. labor market continues to show signs of weakening in the nonfarm payrolls report due on June 3.
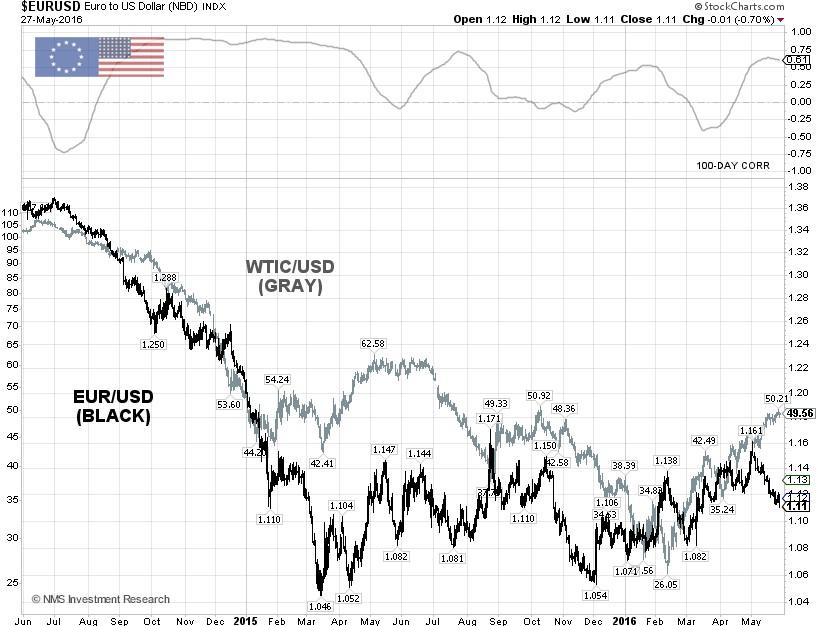
The EUR/USD exchange rate, which is equivalent to the inverted U.S. dollar index, shows a positive correlation (+0.61) with WTI crude over a 100-day period. In the beginning of May, there appears to be a divergence between EUR/USD and the crude price as, over the past two years, the trend has been that crude prices decline following a weak euro or a strong dollar.
The GBP/USD exchange rate, which broke out the 1.456 resistance level, may be signaling that a Fed rate hike at the June FOMC meeting could be off the table. The U.K. referendum on June 23 to determine whether Britain will stay or leave the EU is being held less than two weeks after the FOMC meeting, and polling results are mixed.
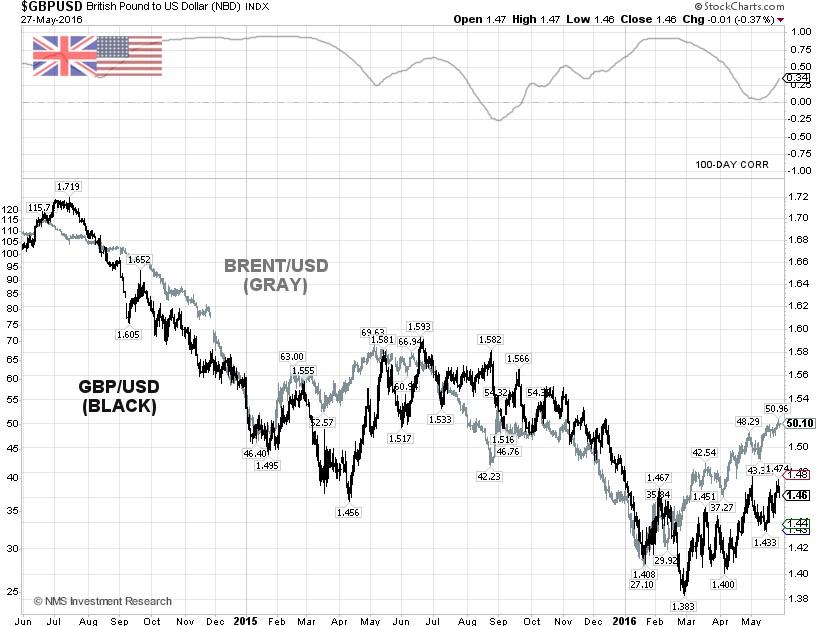
Although the latest poll from a leading market research London-based company, Ipsos MORI, on May 18 showed the remain-campaign leads by 55% to 37% for Brexit, 58% of the people being polled believe leaving the EU would make no difference to peace and security on the continent. The GBP/USD showed a positive correlation (+0.34) with Brent crude over a 100-day period, implying that the crude price may become a less important factor for the currency pair in the near term.
Conclusions
The price of crude oil has rebounded about 90% from its February 11th low, fueled by headline news, and may be due for a technical correction. The timing of the correction is difficult to predict but the price of crude typically sees a decline around the Fourth of July. The divergence between the WTI crude price and the yield spread of the 10-year and 2-year U.S. Treasury Notes, one of the economic indicators, is widening, meaning the crude price at this level might not be sustainable. A correction in crude prices will hit the Forex market, as the AUD/USD, CAD/USD, EUR/USD and GBP/USD exchange rates are positively correlated to crude oil.
Disclosure: I/we have no positions in any stocks mentioned, and no plans to initiate any positions within the next 72 hours.
I wrote this article myself, and it expresses my own opinions. I am not receiving compensation for it (other than from Seeking Alpha). I have no business relationship with any company whose stock is mentioned in this article.
Source ↔ MP3 Lagu Baru


